Readings:
- Alan Dix. 2013. Mental Geography, Wonky Maps, and a Long Way Ahead. In Proc. GeoHCI (workshop at CHI 2013).
- Alan Dix and Geoffrey Ellis. The Alan Walks Wales Dataset: Quantified Self and Open Data. Journal of Open Data as Open Educational Resources (2015), 56-66.
Agenda:
- Brief revisit of reading group and introductions of anyone new
- Our time this week overlapped with faculty meetings
- Core ideas for TotT; see previous week
- Attendance: 7 people(1 professor, 4 graduate students, 2 undergraduate students, including 2 new faces)
- Summarize papers
- Discuss papers
Discussion:
We started with an overall discussion of the Alan Walks Wales project from miscellaneous outside readings by a few of the reading group members. This week, our two papers were very recent, so we only touched briefly on whether new tools or techniques (most specifically to dealing with open, large data sets) existed since the time of the paper’s publishing.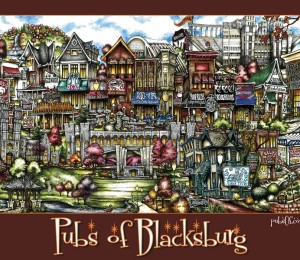
Following the suggested definition of a wonky map from Alan Dix’s paper, we put forth as our own example the PubsOf poster shown here of our own local bars drawn by Brian McKelvey. It is “wonky”, as it doesn’t faithfully represent the town of Blacksburg but includes distortions that highlight key destination points (i.e., pubs).
With this example and the paper in mind, we talked about the definition of a “map.” One person suggested that a map depicted places that are roughly co-located with an emphasis on directionality, and another suggested a map was a graphical representation of physical places.
From the discussion of maps, a few interesting threads of conversation arose. We debated, especially for the purposes of travel or hiking, whether a map based on time-to-travel rather than physical distance might be possible. Traveling the distance up a mountainside takes far longer than traveling the same distance on flat ground. We also talked about examples like subway maps which commonly shrink the map of rails into more of a conceptual understanding of intersections, especially to fit on smaller pieces of paper or near the ceiling of a subway car.
We also discussed what it’s like to describe directions using landmarks to someone unfamiliar with the area, especially in the context of back routes or walking through alleys and grassy areas; sometimes we just say “follow me” to lead a stranger through campus instead of trying to describe such a thing. We also talked about on-the-ground assistance people give each other that traditional maps can’t provide, such as a trailhead marker that has a slider for its condition.
We talked about what it would be like if trail maps were read the same way as street maps, or if they were described solely in terms of landmarks. One of us suggested there are three ways to navigate by landmarks: solely on landmarks, landmarks plus direction, and purely on a sense of distance between landmarks. We also hit on the significance of general map literacy, going again back to A Walk in the Woods in which the author went into the experience with fairly robust map-reading skills, such as when he found a logging road to get around an impassable mountain in a storm.
We connected the two readings when talking about what maps could be generated from information collected on the ground. A map of the difficulty of the terrain could be generated based on the people actually traversing it. We talked about how user-generated maps might also capture those back routes that traditional maps miss that would normally spread by word of mouth only, or other issues like seasonal closures.
When discussing open data in classrooms, we hit upon the pros and cons of giving students entirely unexplored sets of data as open-ended puzzles to figure out. We talked about the need, also stressed in the paper, to clean the data beforehand. We felt a big issue could be the student not knowing how or where to get started with such an open problem. The data feeling irrelevant to the student could also be an issue. We talked about whether working with the data of hundreds of people in the set might make it more interesting to work with. However, that still might not make the data feel relevant to the student, and more isn’t always better. What the student cares about might not be something numerical data can capture.
We talked about two ways to approach data: either look for insights in an open-ended manner, or try to verify a hypothesis. The two are not always mutually exclusive. We talked about how readers of a blog might feel more connected to the story if they had access to tools to analyze and gain insights about the data contained in it, and specifically whether that would make readers feel more connected to the Alan Walks Wales story when they might not have before.
We talked about the potential of tying personal data sets, such as one generated by Fitbit, into publicly accessible data sets, such as meteorological data. Enriching data after the fact with additional public data would be an interesting area of study. However, we talked about the downside of highly localized data; going back to the meteorological data, weather can be very different in one area than it is only half a mile away, such as in a valley and on top of a foothill, and it’s less likely that publicly available data sets would match your exact experiences. Aggregating the data of many people with similar private data might crowdsource some of that specificity in an interesting way.

The discussion of generating a map based on physical terrain resurrected ideas I have had about mountain summits. On particularly alluring peaks, trails are formed for the purpose of reaching the summit. Sometimes there is an “easiest route” and more challenging routes along other sides of the mountain (the reason commercial Everest expeditions focus on summiting from one side of the mountain). However, even if there are multiple routes up a mountain, experiences can vary depending on conditions or even understanding of the map.
I remember a particular experience I had at Mount Tallac in South Lake Tahoe where we hiked to the summit in early June. As we gained elevation, parts of the trail were still covered in snow. This became problematic closer to the summit as we had to scramble past areas of heavy snow. We began to scramble toward a false summit because our understanding of the trail map was “scramble to the summit”, thus causing a longer detour that we expected. I compared my experience to a friend’s hike where they had summited in early August. All of the snow had melted, and they did not have to scramble around snow. Technically, we were on the same trail. However, our paths were different. I imagine if my hiking group had used a GPS that gave directions similarly to how Google maps would have, the redirection around the snow would have been different. We saw other hikers bypassing the snowy sections in ways that varied from our ideas. I really like the idea of tracking the different routes that hikers take to bypass areas and learning about the different experiences on each route. I think that could generate an interesting cartography.
LikeLike